Encontrar

Article
· Août 16, 2024 4m de lecture

TestCoverage Embedded Python and UI

Two big changes for the TestCoverage open source tool: Embedded Python support, and a new UI 

Embedded Python

Previously, TestCoverage could only track unit test coverage for code written in ObjectScript. It would ignore code written in other languages like Python in the coverage statistics.
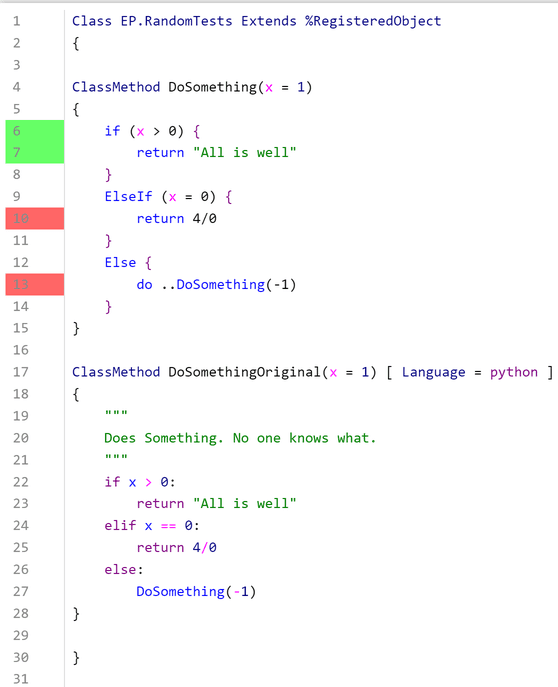
 

As more and more IRIS application code is being written in Embedded Python instead of just ObjectScript, it's critical that TestCoverage can include coverage results for Embedded Python code. Customers (through the TestCoverage GitHub issues) as well as others in InterSystems have expressed interest in seeing Embedded Python support.
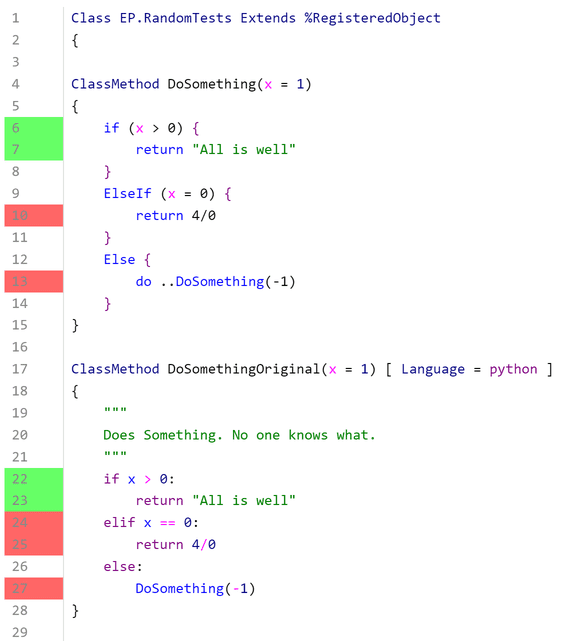
 

The user still installs and runs TestCoverage the same way as before, as described on the TestCoverage GitHub. The coverage results for Embedded Python code now get included in the aggregate coverage statistics as well as the individual line coloring, as displayed in the above example. 

Under the hood, the Embedded Python coverage is tracked using Python's sys.settrace tracer, independently of ObjectScript's %Monitor.System.LineByLine, and then the results are combined and displayed together. This can cause very minor discrepancies in which lines are marked as executable (i.e. can be run at all). For instance, in the above picture, Python considers the elif statement as executable, but ObjectScript does not consider the ElseIf statement as executable. At the end of the day, any line of code marked red was not covered, and any line of code marked as green was still covered; this just slightly affects which lines of code we ignore, which doesn't cause any problems. 

New TestCoverage UI 

The previous TestCoverage UI was an old Zen UI that didn't surface many of the useful statistics that TestCoverage tracks. In addition, TestCoverage could only be run from the command line. 

To solve these problems, we've created a new Angular UI building off of isc.perf.ui, the existing UI for interacting with the Line-By-Line Monitor (^%SYS.MONLBL). The web application comes with an accompanying REST API and WebSocket connection to retrieve data from the IRIS server. It also fixes the previous user authentication for isc.perf.ui, so that it now uses standard IRIS login/logout. This is also publicly available on the Open Exchange, under the name isc-perf-ui. Below are some of the new UI's features and uses. 

Installation

There are some additional steps for installing isc.perf.ui if you want to use the new TestCoverage features. On Windows only, you need to enable the IIS WebSocket protocol. On any OS, you need to give a specific user (usually CSPSystem) a resource permission (usually %DB_User) in the IRIS management portal. These steps are described on the isc-perf-ui GitHub page

Test Coverage Page

On the Test Coverage page, you can select the parameters that you want to run TestCoverage on your unit tests with.
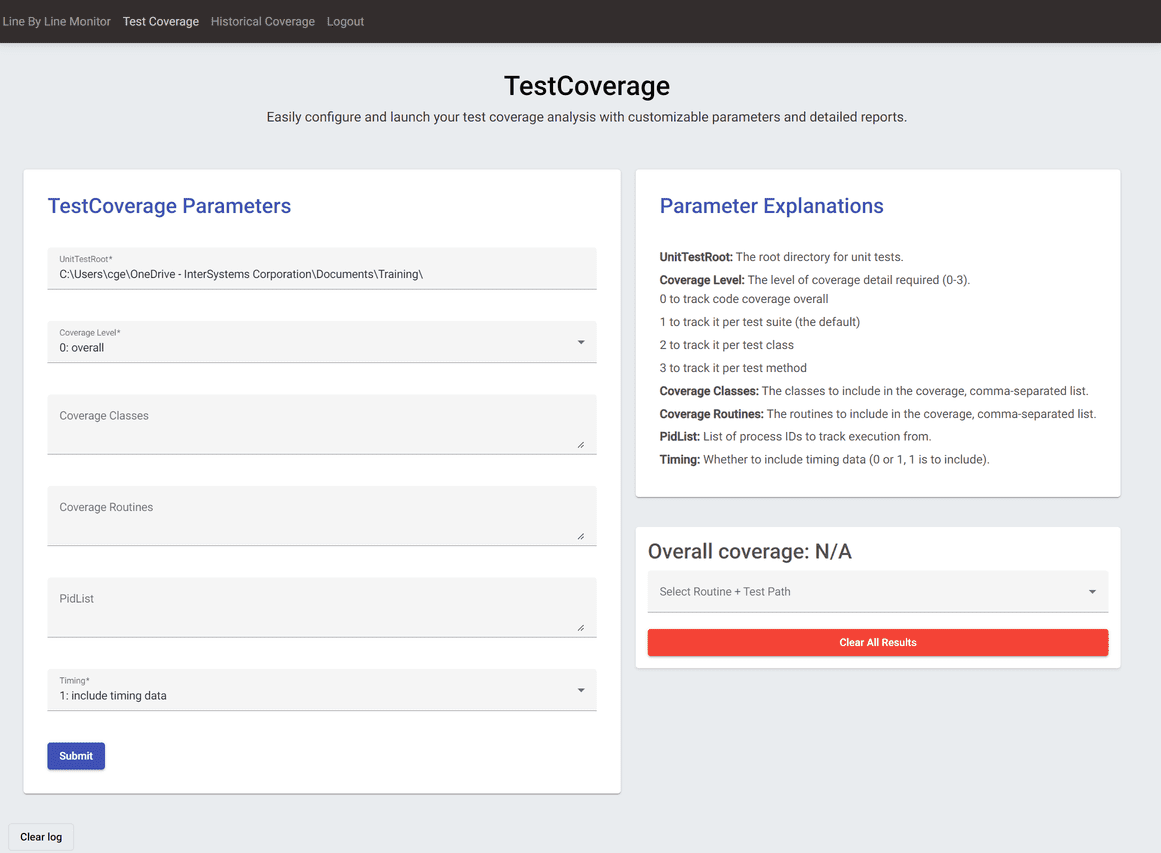
  

The parameter explanations include descriptions of what each of these parameters control. You can also click into an input box to see a sample value, and there's input validation to make sure that your inputs are in a valid format.

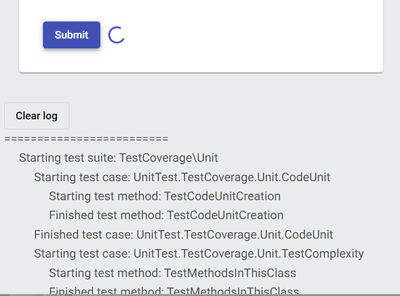
After you press submit, the call to run TestCoverage will begin, and you'll see live progress of your unit tests in the log at the bottom of the page. 
 

After the tests have finished running, the dropdown select menu on the right should open with a list of routine + test path combinations, as well as the overall coverage percentage for your code and the link to the results of the unit tests themselves.
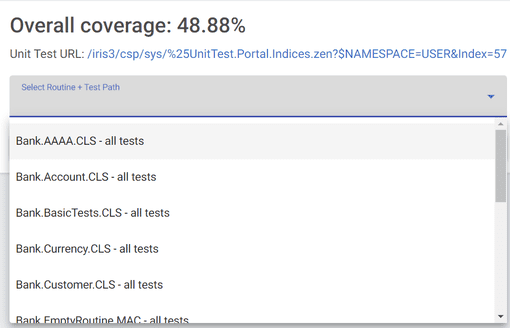
 

Click on any to be taken to the coverage results page for that routine under that unit test directory.

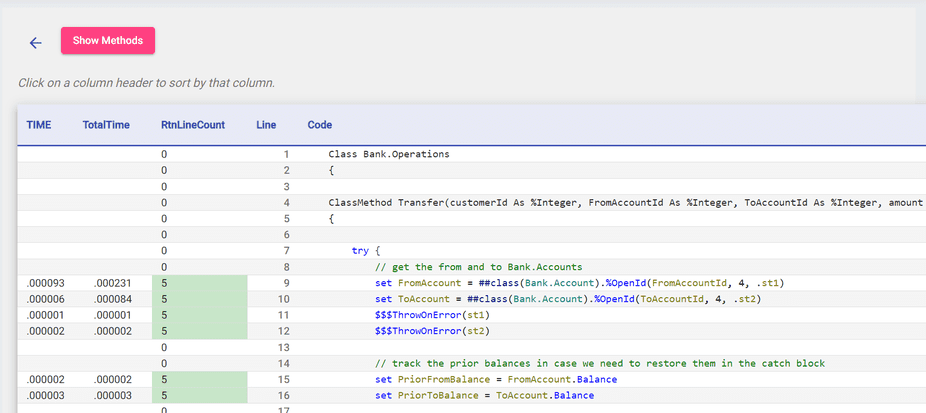
Here, you can see which lines of code were covered by your unit tests according to TestCoverage. There are also additional metrics like TotalTime, which tracks the amount of time the code spent on a certain line of code from its start to finish. 
 

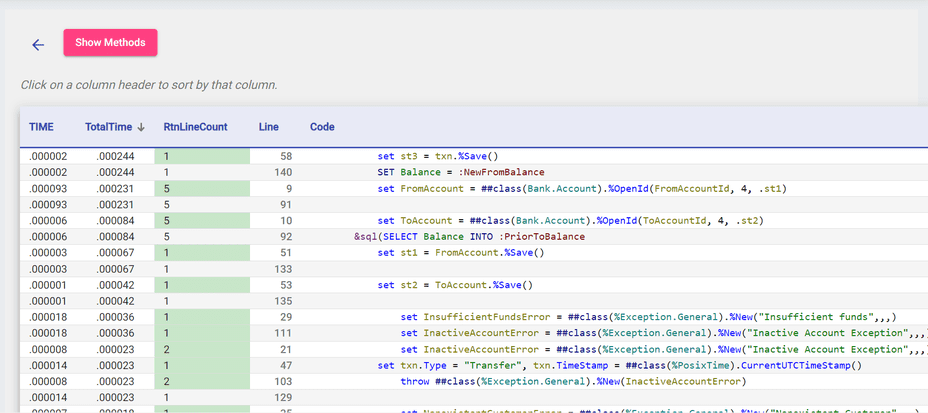
You can further sort in ascending or descending order by clicking on the arrows next to the headers; this is a useful way to see which lines of code take the longest. 
 

Finally, the Show Methods button opens up a table with the cyclomatic complexity of each of your methods, showing which methods are the most complex and vulnerable to bugs. 


When you're done, can click the back button to go back to the launcher page. The red clear results button lets you clear all your test coverage runs.
 

Historical Coverage Page

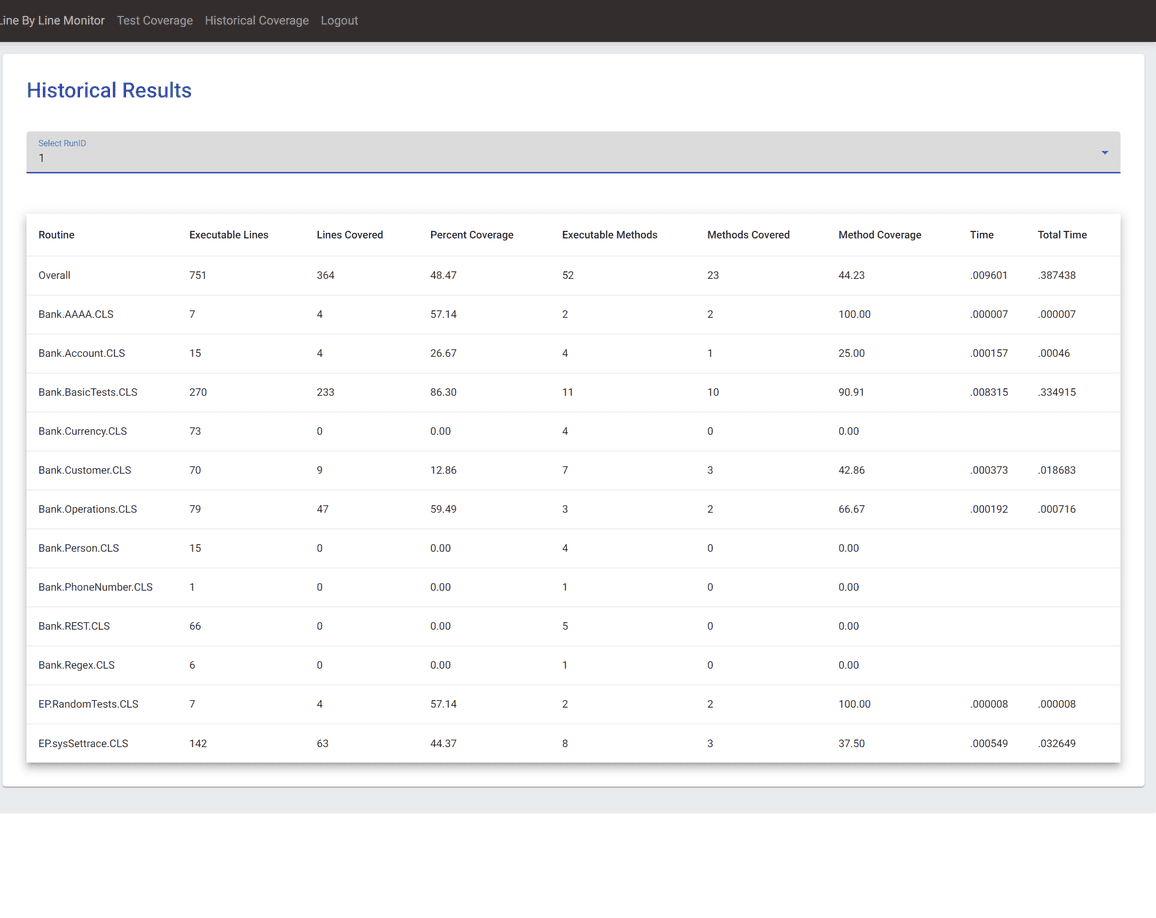
After clicking on a specific past Run ID, you can view the class-level coverage results (line coverage, method coverage, timing) for all the classes in that run. This is the same data as the main results page from TestCoverage. This table is also sortable by each column. 


Again, both tools are available on the InterSystems Open Exchange (isc-perf-ui and Test Coverage Tool) and on GitHub. Good testing to everyone! 


4 Comments
Discussion (4)3
Connectez-vous ou inscrivez-vous pour continuer
Question
· Août 15, 2024

There's any way to check if some part of the code is an abbreviated command?

Hello every one, here in our company we are trying to develop a tool to help us in our "Code Review" that today is completely done for another developer.

So I need to develope a tool that reads a class/routine (Already done) and identify if in the current line there is some abbreviated command, that is against our policy of codification, for example:

s variable = "test"
d ..SomeMethod()

So in this cases I want to warn the original developer that the code has parts that need to change the "s" to "Set" and de "d" to "Do".

I tried to found some library in the documentation but with no success, if there's any way to do It will help us a lot.


Thank all of you so much. 

6 Comments
Discussion (6)2
Connectez-vous ou inscrivez-vous pour continuer
Question
· Août 12, 2024

Error consultando foreign table en MySQL

¡Hola estimados miembros de la comunidad!

En esta ocasión no vengo con ningún artículo sino con un problema que me he encontrado al definir una conexión a una tabla ubicada en una base de datos externa en MySQL.

Estoy haciendo algunas pruebas con la funcionalidad de las Foreign Tables incluidas en IRIS que permite incluir tablas externas en modo consulta como si fueran propias de IRIS y he visto que funciona perfectamente con una tabla ubicada en PostgreSQL, el problema ha sido al intentar hacer lo mismo con una tabla de MySQL, he seguido los siguiente pasos como indica la documentación:

  • Paso 1: He creado la conexión a la base de datos de MySQL desde la configuración de SQL Gateway connection: **AVISO** si el nombre del fichero que contiene el driver es demasiado largo IRIS no podrá cargarlo.
  • Paso 2: He creado el Foreign Server:
    CREATE FOREIGN SERVER Test.MySQLDB FOREIGN DATA WRAPPER JDBC CONNECTION 'MySQL'
  • Paso 3: He creado la Foreign Table:
    CREATE FOREIGN TABLE Test.PatientMySQL SERVER Test.MySQLDB TABLE 'patient'
  • Paso 4: He lanzado al consulta a Test.PatientMySQL:
    SELECT * FROM Test.PatientMySQL

Y este ha sido el error:

[SQLCODE: <-230>:<Foreign table query Execute() failed>]

[%msg: <Foreign Tables - ERROR #8104: Gateway Exception: <GATEWAY> java.sql.SQLSyntaxErrorException com.mysql.cj.jdbc.exceptions.SQLError.createSQLException(SQLError.java:112) Remote database reported error: You have an error in your SQL syntax; check the manual that corresponds to your MySQL server version for the right syntax to use near '"patient" T1' at line 1>]

Como podéis ver, el problema son las dobles comillas que aparecen en el nombre de la tabla en la consulta que IRIS está ejecutando, MySQL es incapaz de reconocerlo y nos devuelve ese error. Por si acaso he revisado la versión de MySQL y el driver utilizado y ambas son la versión 9, así que no parece que sea eso.

¿Es un bug para MySQL? ¿He configurado algo erroneamente?

¡Gracias por adelantado!

1 Comment
Discussion (1)1
Connectez-vous ou inscrivez-vous pour continuer
Annonce
· Août 7, 2024

InterSystems开发者社区中文版:中文社区最佳贡献奖公布(2024年7月)

Hi 开发者们,

2024年7月,我们开启了💡“中文社区最佳贡献奖”💡活动,截至目前,社区共有成员1900余人,7月新增成员46人。

🎉🎉🎉🎉获奖名单公布🎊🎊🎊🎊

在综合考虑了发帖量、评论等社区贡献后,我们宣布7月“中文社区最佳贡献奖”获得者为:

🆕新增成员 @y g

👍现有会员 @姚 鑫

恭喜两位,我们将寄出奖品:《AI医疗革命》。


为感谢大家的积极参与,鼓励更多社区成员积极贡献到社区建设中,我们还将为以下成员送上奖励:

🆕新增成员 @zhangchao  @biubiu biubiu 

👍现有成员 @deng hang  @liu bo 

🍀恭喜以上获奖成员,我们将寄出奖品:InterSystems开发者社区定制礼品一份🍀

🏆领奖须知🏆

请以上获奖成员及时通过站内信与 @Claire Zheng 沟通奖品领取事宜(截至2024年9月20 日)。

⏭接下来

我们的活动还在继续,将于9月初公布8月获奖名单!

🍀如果您对此次活动有任何疑问,欢迎跟帖提问!🍀

Discussion (0)2
Connectez-vous ou inscrivez-vous pour continuer
Annonce
· Août 7, 2024

Do you use client-side editing in VS Code? If so, we want your feedback!

The VS Code extension development team is looking for beta testers to provide feedback on a proposed overhaul of the client-side editing workflow. The full list of changes can be found in the GitHub pull request description. Here are the highlights:

  • Support the use of client-side editing in any non-isfs workspace folder, not just folders in your local file system. For example, with VS Code Remote Development.
  • Create an index of all Classes, MAC and INT routines, and Include files inside non-isfs workspace folders. This will be used to determine the URI of classes and routines (for example, for Go To Definition).
  • Automatically sync all file changes, creations and deletions in client-side workspace folders with the connected server. This can be turned off using the new objectscript.syncLocalChanges setting. This new setting replaces the old objectscript.importOnSave setting, which is no longer needed. If objectscript.importOnSave was set to false, the extension will set objectscript.syncLocalChanges to false upon activation so no user migration is required.
  • Automatically show and hide the InterSystems Explorer and Projects Explorer views based on the folders in the workspace. InterSystems Explorer is only shown if there is at least one non-isfs workspace folder. Projects Explorer is only shown if there is at least one isfs folder. This replaces the objectscript.showExplorer setting.
  • Change the default value of the objectscript.explorer.alwaysShowServerCopy setting to true. The InterSystems Explorer should always show the server copy since the local copy can be opened from the files explorer.
  • Change the default value of the objectscript.autoAdjustName setting to false. Now that we have an index of the workspace, we no longer require that a document's name match the file path for the extensions to find it.
  • Cache the list of Studio Abstract Document extensions that are supported for each server connection so we can properly import them from client-side folders. Importing abstract documents is now independent of the objectscript.export settings, except for DFI’s which still check the export settings to preserve the current path-splitting behavior. Any file within a workspace folder that has a supported abstract document extension will be imported with the last part of the path used as the server name (except for DFI’s that match the export settings). For example, if the file path on disk is /src/other/example.ext, the server name will be example.ext.

In addition to general feedback on the changes, there are four design questions that have yet to be answered:

  1. Do any users want the InterSystems Explorer (NOT the default VS Code file explorer) to show the local copies of the documents? If not, the objectscript.explorer.alwaysShowServerCopy setting can be removed. EDIT: This setting will be retained for backwards compatibility.
  2. Do any users edit DFI files locally and have repositories that depend on the folder splitting behavior? If not, that special handling will be removed and DFIs will be treated like any other Abstract Document type. EDIT: This behavior will be retained for backwards compatibility, but newly exported DFI files will not be split into subfolders.
  3. Should the automatic deletion of files on the server when the local copy is deleted be guarded by a setting so users can disable it? EDIT: This is covered by the new objectscript.syncLocalChanges setting.
  4. This extension has a feature that will attempt to adjust the name of a class or routine when it's copied or moved to a new location within the workspace folder. This was implemented to help developers keep the file path and document name in sync. It can be turned off using the objectscript.autoAdjustName setting. Do users value this feature? Should the objectscript.autoAdjustName setting be set to false by default? Should this feature be removed entirely since the document index removes the need for the path to match the document name? EDIT: This setting's default has been changed to false.

Here's how you can share your feedback:

  1. Download the zip file at the end of this post and extract the vsix file contained within.
  2. Install the vsix file in VS Code using these directions, or by dragging the file from your file explorer into the Extensions view in VS Code.
  3. Follow your normal development workflow and try out some new features.
  4. Share your experience here, or on the GitHub pull request.

Thanks in advance for trying this out and we hope you like the changes!

vscode-objectscript-2.12.11-dev.1401.vsix.zip

35 Comments
Discussion (35)10
Connectez-vous ou inscrivez-vous pour continuer